Four things it usually is
Six things cause a bad air day in the US. Only one of them is fire. The list: wildfire smoke, a winter temperature inversion, ground-level ozone, dust storms, wood smoke, and the ordinary traffic-and-industry baseline underneath all of it. Search interest for this exact question peaks twice a year — July and February, a genuine winter peak against a larger summer one. Every fire-season explainer stops at the July half. This one covers both. It also covers the two directions the number and your senses can disagree.
The six things that actually cause a bad air day
Wildfire smoke gets the coverage. It’s the one you can photograph. But it splits into two versions that read differently on a monitor. Near-surface smoke is what the AQI number is built to catch. Smoke aloft is different — smoke sitting a few thousand feet up, visible as a strange sunset, that a ground-level sensor barely registers. Seattle residents named this mechanism themselves, on a hazy day that read a clean 30 AQI. “Air sensor on ground, smoke up high (for now)” (949↑, r/Seattle). Another summed it up in four words: “Sky biiiig, smoke faaar” (354↑, r/Seattle).
Thermal inversion is the winter mechanism. It has nothing to do with fire. Warm air settles over a metro and traps a cooler, denser layer underneath it — a cold air pool. Exhaust has nowhere to go. Denver’s “brown cloud” is this temperature inversion made visible. It’s pollution that “gets trapped in cooler air close to the ground by warm air higher up in the atmosphere,” one resident explained (300↑, r/Denver). The civic vocabulary that grows around an inversion is its own tell: red air day, mandatory no-burn day, air quality action day. People search those terms hardest along the Wasatch Front valleys, where a winter inversion sits worst. They attach to real local rules on wood stoves and fireplaces. But those rules are written by state and county agencies, and they differ by both. Check your own state’s environmental agency for what’s actually in force where you are. We don’t restate a burn ban we haven’t read. The same valley inversion physics runs through the Allegheny valleys around Pittsburgh, the San Joaquin Valley, and interior Alaska.
Ground-level ozone is the third mechanism. It fools people checking the sky instead of the reading, because it’s invisible and odorless. Sunlight cooks vehicle exhaust into a gas nobody can see or smell. A widely-upvoted r/Denver post put both pollutants in one frame: “we’re essentially sitting in a giant bowl of both high pm2.5 and high o3. A proverbial ‘double whammy’” (567↑). One reply named the trust problem: “spreading awareness about ozone is tough because it’s mostly invisible and odorless. Telling people they’re breathing in a toxic invisible gas is a sure way to kill the vibe” (9↑, u/SirTaffet).
Dust events are the fourth mechanism. In the Southwest, the visible version is a haboob — a wind-driven wall of dust that can drop visibility to nothing in minutes. Phoenix built its own vocabulary for it, borrowed from Arabic by a local meteorologist decades ago (454↑, r/phoenix). Wood smoke is the fifth — agricultural burning and residential fireplaces both. It’s the cause most likely to overlap with an inversion. The same cold air pool that traps traffic exhaust traps chimney smoke too, building wintertime particulate matter — PM2.5 winter’s dominant pollutant — for days with nowhere to go.
The sixth cause is the least interesting and the most constant. Ordinary traffic and industrial exhaust runs every city, every day, rain or fire or clear sky. It’s the baseline the other five stack on top of. Most bad-air days aren’t one mechanism alone. They’re this baseline, plus one thing going wrong on top of it.
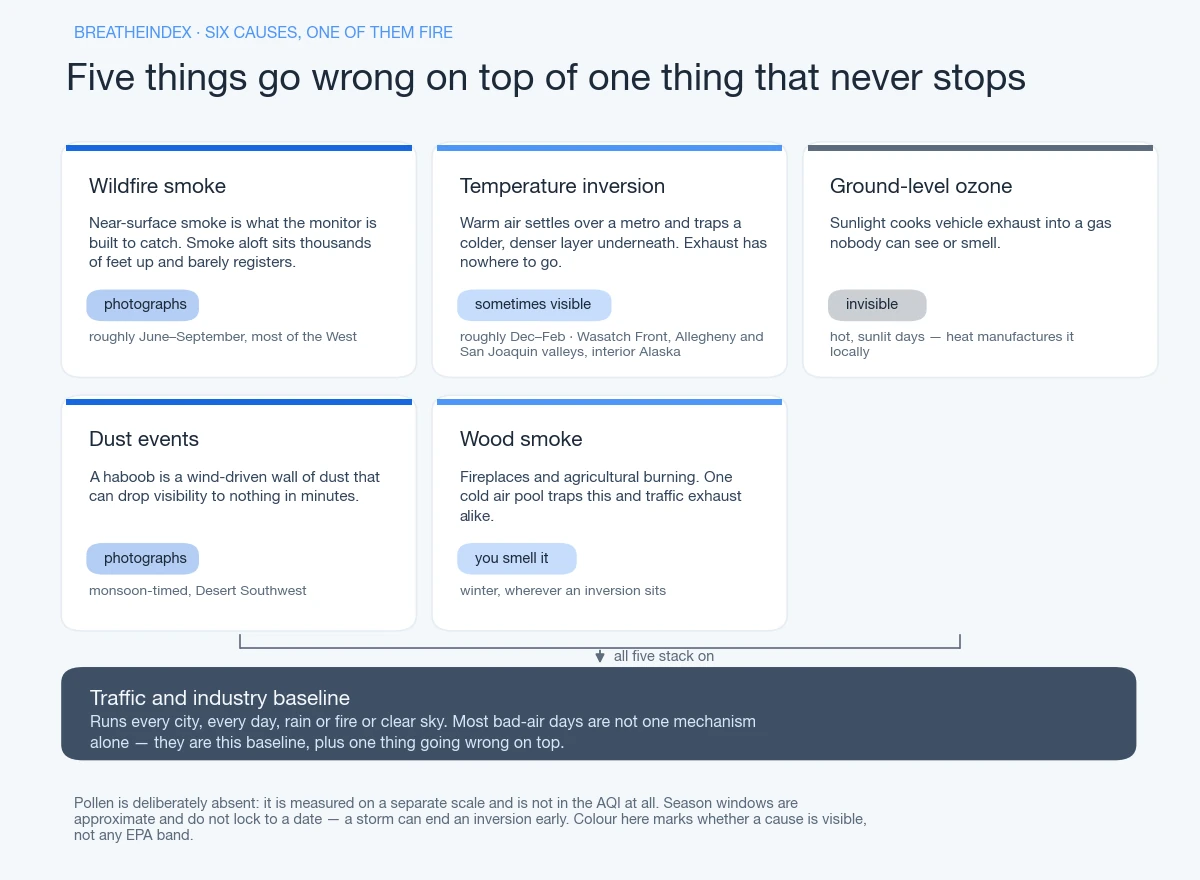 Only one of the six is fire. The bar underneath is the sixth — most bad-air days are that baseline plus one thing going wrong on top of it.
Which metros have a named cause active right now
Some of this runs on a clock, loosely. Wildfire smoke season stacks up roughly June through September across most of the West. Inversion season runs December through February, in every valley metro this site tracks. Dust and haboob activity is monsoon-timed in the Southwest. None of it locks to a fixed date. A storm can end an inversion early some years. A monsoon can arrive late in others.
That list updates against the same live feed as every city page here, not against whenever you’re reading this. Treat it as this moment’s read, not a permanent ranking. A metro carrying an active cause links to the page explaining its mechanism, at the depth a national page doesn’t have room for. That might be a brown cloud, a haboob, a Wasatch Front inversion, whatever’s actually running there today.
Why February is just as bad as July
Type “why is air quality bad today” into Google and the volume is bimodal. July gets 74,000 monthly searches, the wildfire-season peak. February still gets 40,500 — a genuine winter peak, 55% of July’s volume, five months apart. The broader bucket around this question runs 18,100/mo at a $13.91 average cost-per-click. A narrower phrasing of the same question (“why is the air quality so bad today”) costs $14.56 — among the highest CPCs measured anywhere in this niche. A control comparison makes the split obvious. “Air quality chicago,” a metro without a strong winter mechanism, moves only 25% above its summer baseline in winter. “Air quality spokane,” which gets smoke but little inversion, moves just 8%. Salt Lake City’s own volume moves 153%, and peaks at 27,100 in January.
Nearly every published “why is the air bad today” explainer assumes the answer is fire. Fire is the July half of that curve. It is not the February half. February’s answer, for most metros that spike then, is the mechanism above. A cold air pool traps exhaust and wood smoke, with nowhere to go, sometimes for a week or more — no fire anywhere near it. It takes a storm to break the cap. It does not take a calendar date.
Smoke aloft photographs before anyone checks a number
A Seattle resident posted the exact photo that makes this direction go viral every time. It showed a bright red sun, a smoke smell in the air, and an AQI reading of 30 — officially “Good.” The replies named the mechanism before any agency did: “Air sensor on ground, smoke up high (for now)” (949↑). Another flagged that the mismatch cuts more than one way — smell without matching particulate: “Usually when it stays aloft I don’t notice an aroma. I guess the odor molecules must be diffusing downward, but the particulate is not” (254↑, u/recurrenTopology).
Three more mechanics stack on top of smoke aloft. None are exotic. AirNow’s AQI is a 24-hour average by design. A genuinely bad hour gets diluted by 23 calmer ones before it becomes today’s headline figure. The app on your phone can also lag behind the live feed, or substitute a neighbouring city’s monitor when the nearest one is down. One Seattle resident traced their own low reading to a sensor in Auburn, miles from where they stood (18↑, u/pnwexpat). And a metro’s AQI is one averaged figure, built from six pollutants. When ozone spikes, a particulate-focused reading can under-represent it. None of this makes the smoke fake. It means the number is a 24-hour average from one station, not a live photo of your block. How a station’s distance and averaging window change what you see breaks the rest down, city by city.
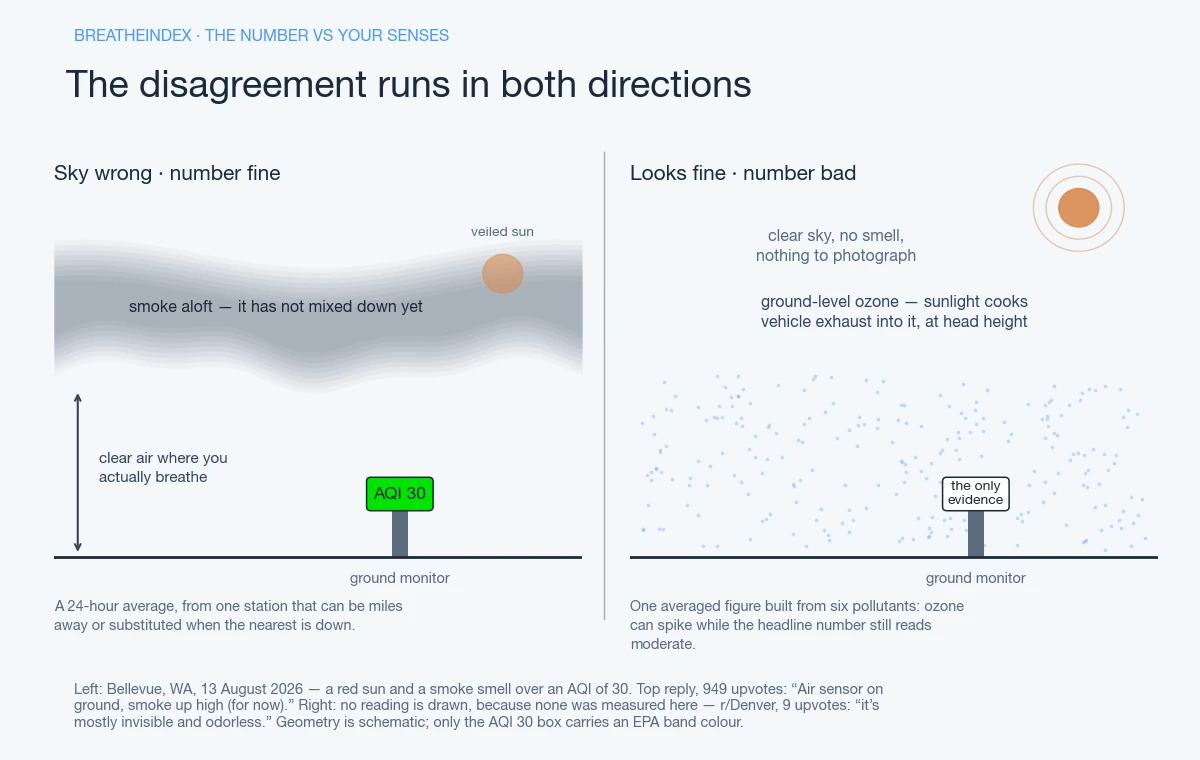 The AQI 30 is Bellevue, WA on 13 August 2026 — red sun, smoke smell, officially Good. The right panel carries no number because none was measured; that is the point of the direction.
Ground-level ozone doesn’t photograph at all
That’s the whole trap in this direction. No smoke smell, no orange sky, nothing to point a phone camera at. One Denver resident named exactly why this direction gets ignored, on the “double whammy” thread above. “spreading awareness about ozone is tough because it’s mostly invisible and odorless. Telling people they’re breathing in a toxic invisible gas is a sure way to kill the vibe” (9↑). Someone else on that thread reported real symptoms with nothing visible to blame. “I’m young and fit but can feel the smoke in my eyes and throat after I’m outside for 30-60min” (163↑, u/sparkymeowmeow). Worth noting plainly: ozone alone, with zero wildfire smoke nearby, can produce that exact feeling. Heat and sunlight manufacture it locally.
One parent posting in r/Mommit summed up the whole direction in a single line. Her husband looked out the window and called the day fine. She couldn’t shake the feeling that “all the harmful stuff is invisible” (30↑). A clear sky and a clean nose aren’t the same test as a monitor. Ozone fails both, by design. The six-pollutant masking problem from the section above runs the same way here, in reverse. Ozone can spike while the number still reads moderate.
Pollen isn’t in this number at all
None of the six causes above are pollen. That omission is deliberate, not a gap in how the AQI is built. Pollen counts and the Air Quality Index come from two separate measurement systems, on two separate scales. A brutal pollen day can sit next to a genuinely good AQI reading, with nothing contradictory about that pairing. Atlanta once cleared 6,500 grains per cubic meter. “The highest this year,” a 2019 r/Atlanta thread called it (174↑); a commenter there put it fifth-highest in the city’s 28 years of records. That day’s AQI said nothing about any of it. It was never built to. If your throat is clear but your eyes and nose aren’t, and the AQI reads good, pollen is the likelier explanation. We haven’t built a national pollen page yet. It runs on entirely separate data from everything else here.
What AQI should you stay inside
Duration and intensity are two separate dials. Conflating them is the mistake people actually make. There are three real answers, not two. Go, with nothing to adjust; a shorter and lighter version of whatever you were doing; or don’t go, full stop. AirNow’s AQI basics class 151-200 as Unhealthy, and 201-300 as Very Unhealthy above it. 151 is the line where the warning stops being about sensitive groups and starts being about everyone. That’s the agency classifying the air, not a verdict on your lungs. A runner on r/beginnerrunning switched to a treadmill rather than guess at their own line. “I don’t run outside when the AQI is at dangerous levels. It’s not worth it. That’s what the gym/treadmill is literally for” (3↑, u/purplishfluffyclouds).
Wildfire smoke shifts this whole table down, about one band, compared with the same AQI number from ordinary pollution. That’s reported independently across several city subreddits. We haven’t found a single number that fits every body. The EPA’s band names are population-level guidance, not a verdict on your specific lungs. The full band-by-band breakdown has the specifics. Set an air quality action day alert instead of checking manually every time the sky looks off.
FAQ
Is it a no-burn day where I live?
No single national calendar exists. It’s a state and county call. States hit hardest by winter inversion, Utah among them, run local no-burn rules tied to red air day conditions. Which rule, and who enforces it, changes by county. We don’t restate any specific one. Check your state’s environmental agency, or your metro’s own page, for live status.
When does the inversion end?
When a storm mixes the trapped air out. Not on a fixed date. A cold air pool under a warm-air lid doesn’t self-correct. A metro can sit under one for a week or more, until wind, rain, or snow breaks the cap.
Why does one app’s AQI number disagree with another’s?
Usually a station difference, not an error. IQAir can substitute a neighbouring city’s reading when the nearest station is down, or lag behind the live feed by an hour or more. How each source builds its number breaks down the gap, city by city.